Prometheus + Grafana 資料監控告警系統
23 Oct 2021Post Directory
Intro
近期公司想要一套監控系統,然後望向 AWS CloudWatch,此時我就推坑 Prometheus(剛好之前有用過),因此就有了這篇文章,之前弄完之後沒有寫下完整筆記,導致這次有些東西還是要在 TryTry 才知道
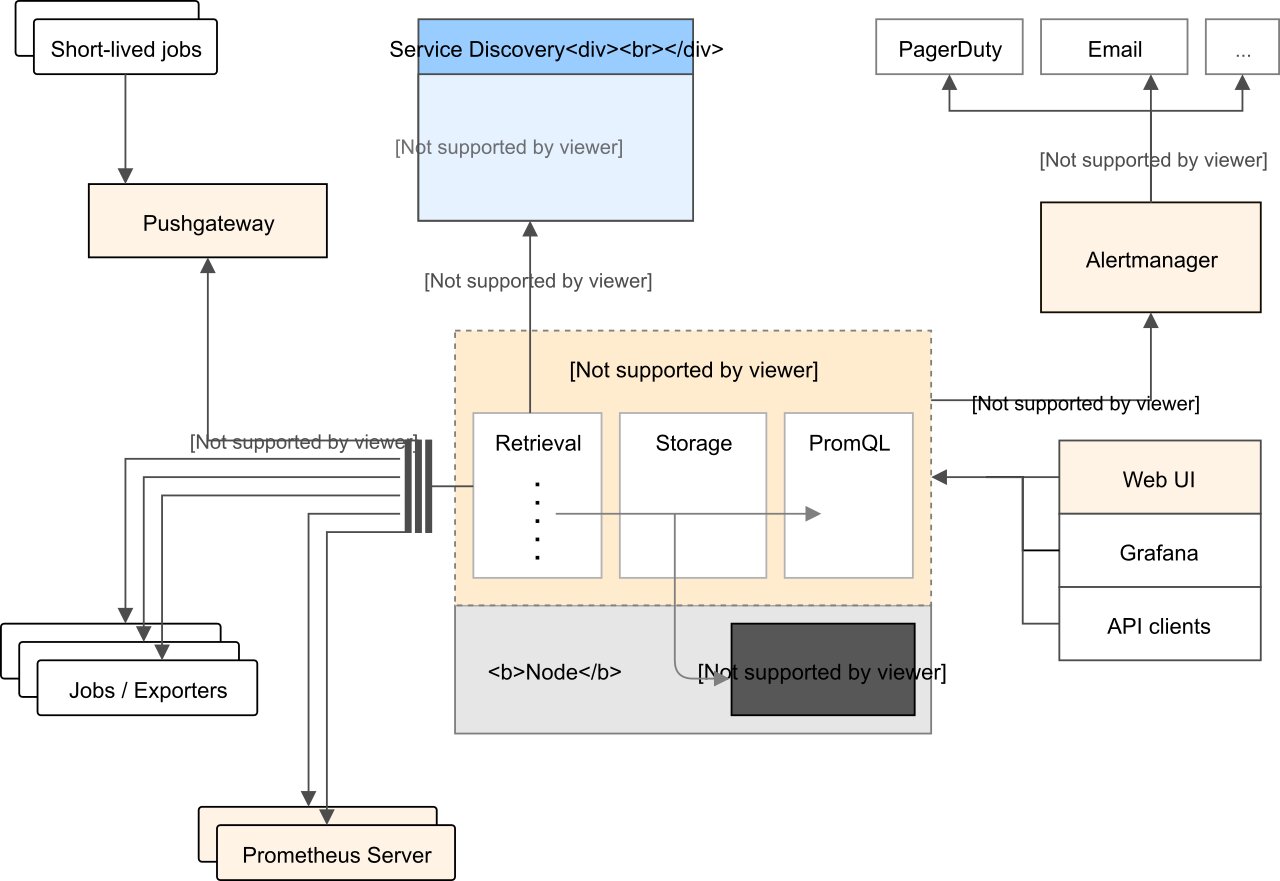
簡單講一下整套系統,公司服務放 EC2 上,然後都用 Docker 跑,所以這邊會需要知道兩項資訊,Host 系統資訊與 Container 資訊
Monitor Server
- Prometheus - 資料收集
- Grafana - 數據顯示
監控目標
- node-exporter - 系統資訊導出
- cadvisor - container 資訊導出
先從 監控目標 來看
監控目標安裝
https://github.com/VagrantPi/monitor-exporter
簡單照著兩個 image 文件寫成 docker-compose
開箱及用,很簡單
不過這邊提一下,由於他會是公開一個 metrics 讓 Prometheus 去定去拿資料,跟 ELK 那種是 Client 往資料蒐集 Server 打不同,所以會產生一個小問題
就是你需要將監控目標打開相對應的 port,然後 default 設定都是沒有鎖帳密的
雖然我們家機器只開 port 讓內網的 Monitor Server 連而已,不過這邊還是簡單幫他上個身份驗證
網路上查到的多數解法都是使用 nginx 作 basic auth
所以要先使用 htpasswd 產出密碼檔案
htpasswd -c htpasswd node-exporter
然後在用 nginx 作簡單的 auth 驗證
# ...
services:
  node-exporter:
    # ...

  cadvisor:
    # ...

  nginx:
    container_name: monitoring_nginx
    image: nginx
    ports:
      - "8080:80"
    volumes:
      - ./nginx/nginx.conf:/etc/nginx/conf.d/default.conf
      - ./htpasswd:/etc/nginx/basic_auth/.htpasswd
    restart: always
nginx.conf
server {
    listen 80 default_server;

    location /node/metrics {
        auth_basic "Restricted";
        auth_basic_user_file /etc/nginx/basic_auth/.htpasswd;
        proxy_pass http://monitoring_node_exporter:9100/metrics;
    }

    location /cadvisor/metrics {
        auth_basic "Restricted";
        auth_basic_user_file /etc/nginx/basic_auth/.htpasswd;
        proxy_pass http://monitoring_cadvisor:8080/metrics;
    }
}
此時可以透過 curl 來測試
curl 127.0.0.1:8080/node/metrics
curl 127.0.0.1:8080/cadvisor/metrics
Monitor Server 安裝
我也寫成了 docker compose,可以簡單的使用,只需要改一下設定檔就好
https://github.com/VagrantPi/prometheus-stack
寫好 config 後 config/prometheus/prometheus.yml
docker-compose up -d
設定檔也很簡單,把你的監控目標填上去,加上 label 就好
prometheus.default.yml
# ...

scrape_configs:
  # test-dev
  - job_name: 'test-node'
    # 前面提到的 basic auth
    basic_auth:
      username: test
      password: test
    scrape_interval: 5s
    # 預設取 `/metrics` 的 endpoint,不過我將兩個 exporter 都反向代理到特定路徑
    # 所以這邊需要設定 metrics_path
    metrics_path: "/node/metrics"
    static_configs:
      # 監控目標 endpoint
      - targets: ['172.31.0.149:8080']
        # 標籤
        labels:
          group: 'test-dev'
          source: 'node'
  - job_name: 'test-docker'
    basic_auth:
      username: test
      password: test
    scrape_interval: 5s
    metrics_path: "/cadvisor/metrics"
    static_configs:
      - targets: ['172.31.0.149:8080']
        labels:
          group: 'test-dev'
          source: 'docker'
grafana-image-renderer
grafana 有提供 Plugin,在 Alert 時,可以輸出 Dashboard 的圖片
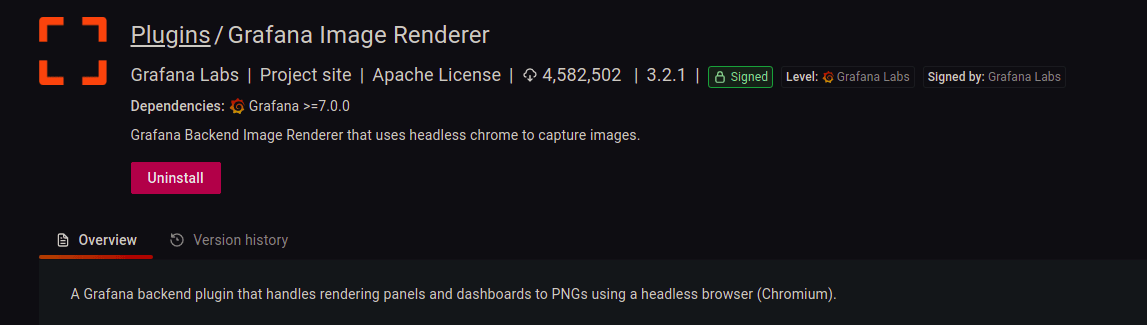
而他在需要而外啟一個 docker 來作 render image 的工作
所以在 docker-compose 會多看到一個
# ...
  renderer:
    container_name: grafana-image-renderer
    image: grafana/grafana-image-renderer:3.2.1
    volumes:
      - ./config/render/config.json:/usr/src/app/config.json
    ports:
      - 8081:8081
不過我這邊遇到了些問題,串接 Telegram 通知會有圖片顯示,但是 Slack 則不會有圖片
這邊可能要在找找問題
接著來啟動 Prometheus 吧!
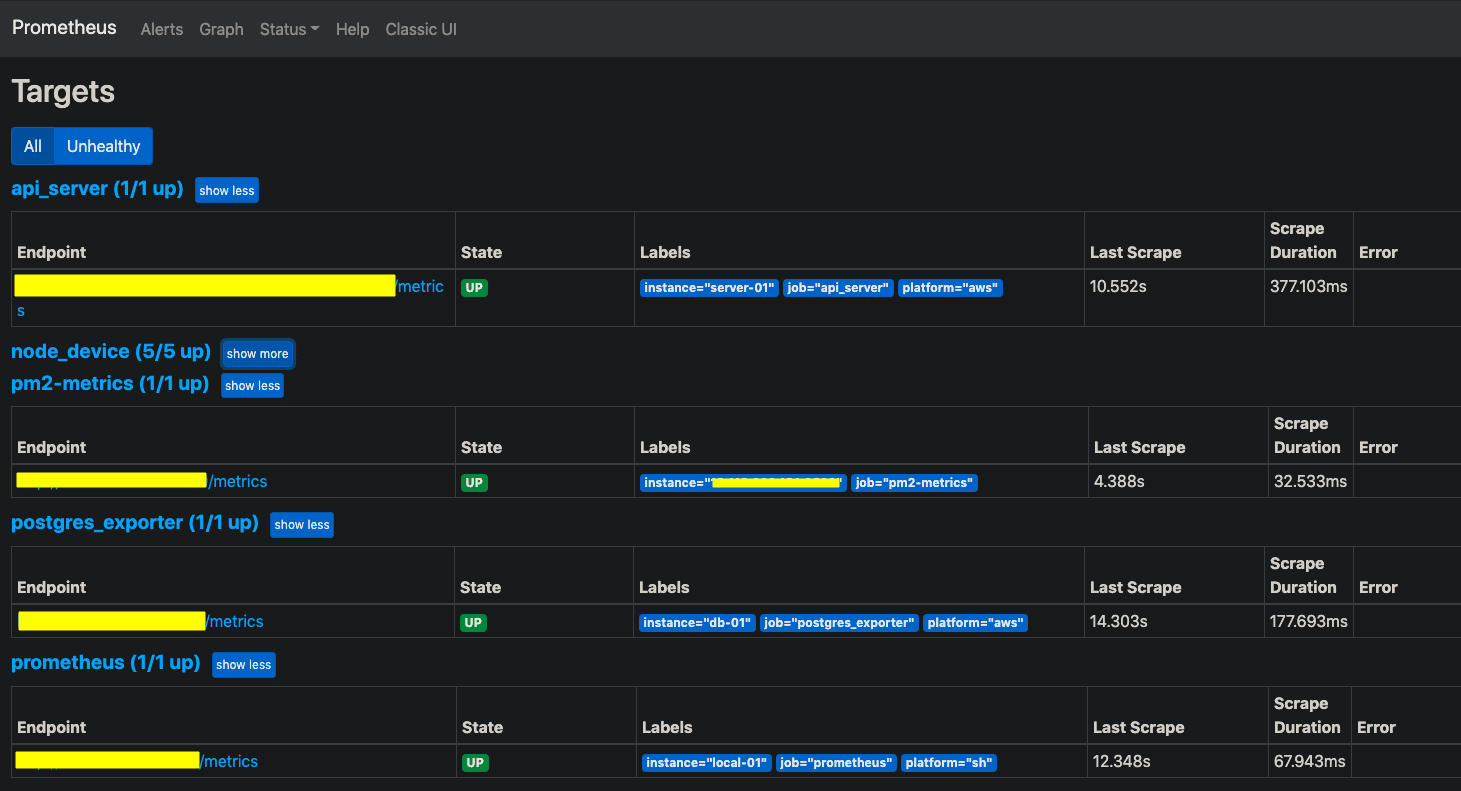
Prometheus Targets
在 9090 port 可以看到 Prometheus 管理界面,點開 Target 頁面
這邊可以看到上面設定檔中的 scrape_configs 底下的 target 狀態
大概會長這樣
Grafana Dashboard
之後打開 3000 port,預設帳密為 admin / admin
使用前需要先在 Configuration > Data source 中加入 Prometheus
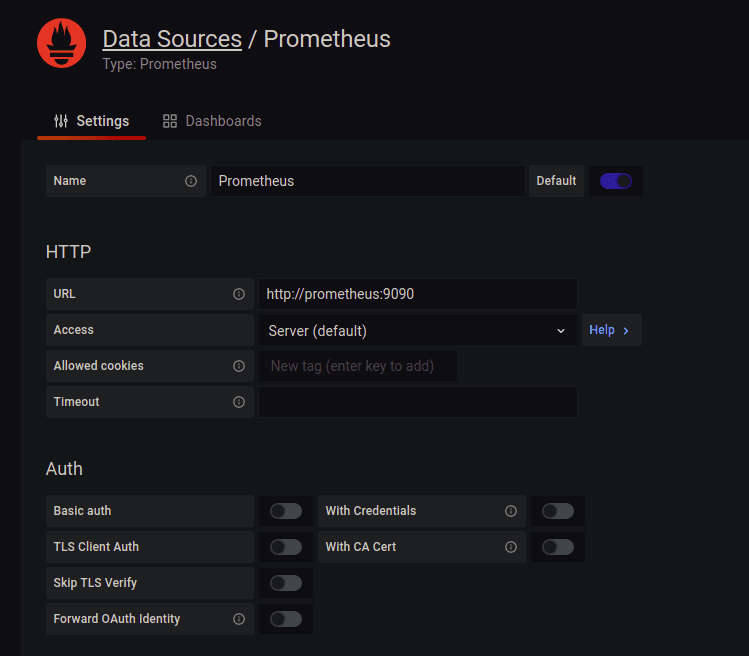
資料來源搞定後,就可以來玩 Dashboard 了!!
可以在官方的圖表庫中 Official & community built dashboards 找別人設定好的 Dashboard 來用
這邊有使用到 Docker and system monitoring 這個 dashboard
點下 Copy ID to Clipboard 後,回到 Grafana,按下 Create > Import
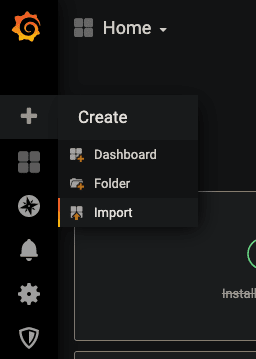
貼上 Dashboard ID
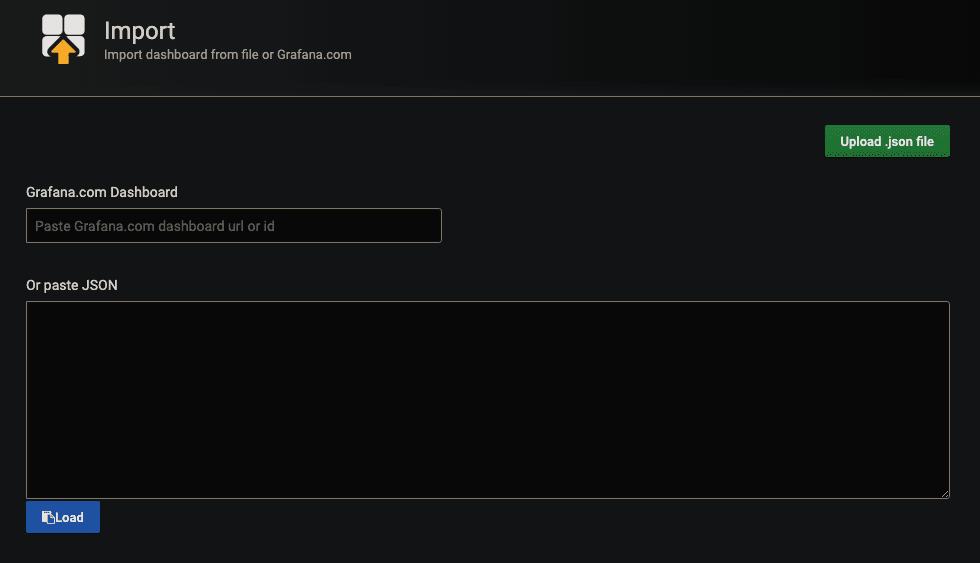
按下 Load 後,就可以匯入 template 了
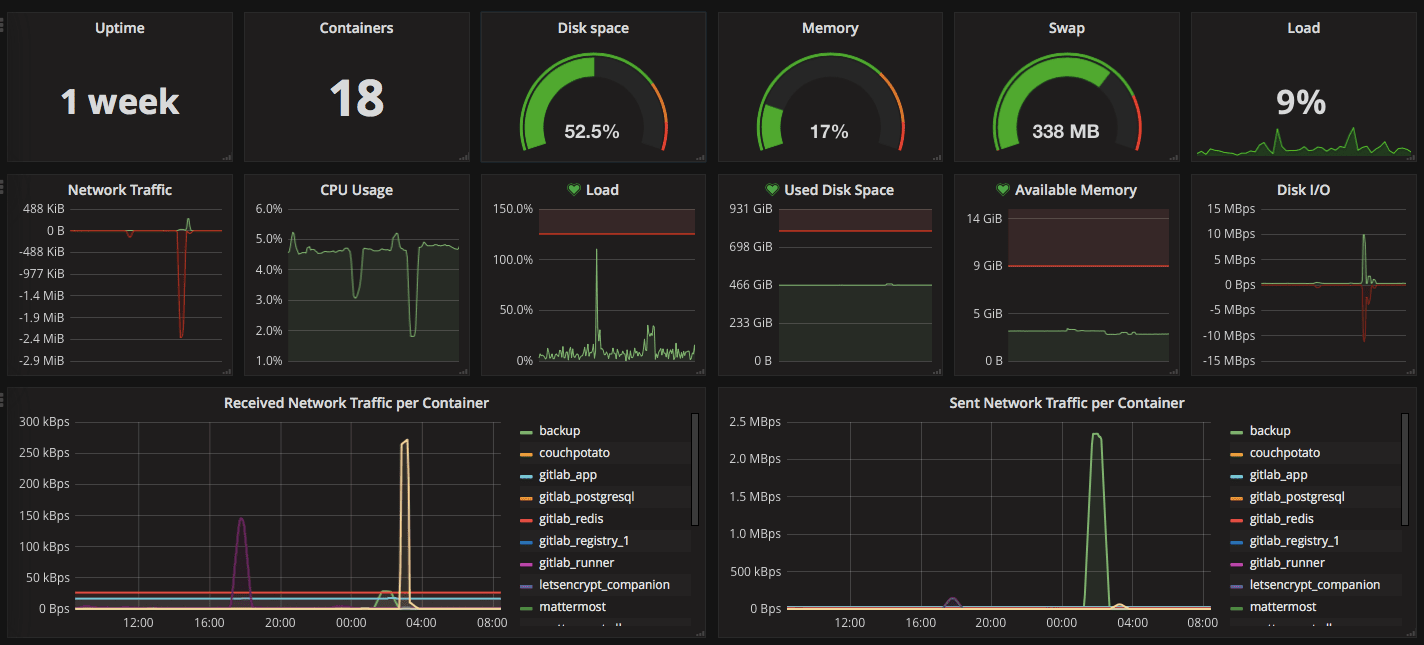
此時可能會看到有些資料有誤,這是因為 Query 的語法,與你定義的標籤不同
PromQL 查詢語法
PromQL (Prometheus Query Language) ,基本上就是透過特定語法取出 target 中的資料
我們我自己弄的 CPU Usage 為例
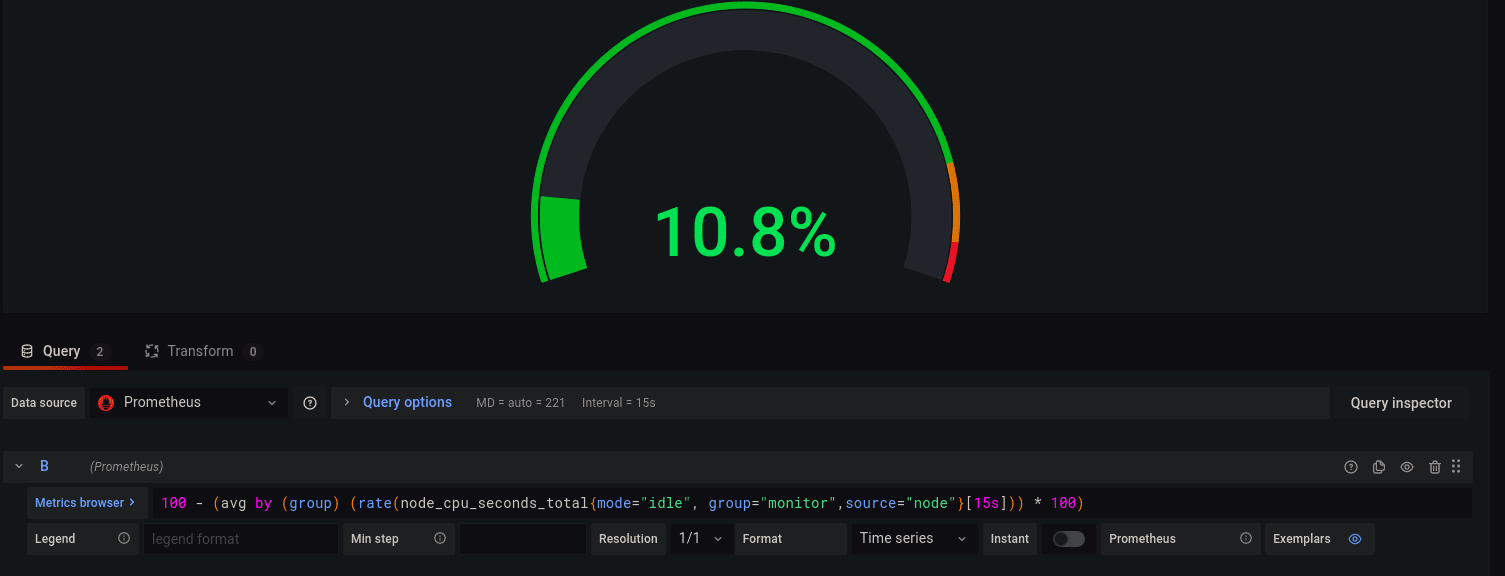
100 - (avg by (group) (rate(node_cpu_seconds_total{mode="idle", group="monitor",source="node"}[15s])) * 100)
簡單說就是
- node_cpu_seconds_total 的 metrics 標籤為 mode=”idle”, group=”monitor”,source=”node”
- 15s 內 avg by (group) 後成以 100
- 然後在用 100 去減掉剛剛算出來的
CPU 平均閒置使用率,就可以得出 CPU 使用率
是不是很簡單呢 (゚∀。)

我基本上想要的數據,除了問 Google 大神外,也會直接 Import 別人寫好的 Dashboard 中的 PromQL 來用
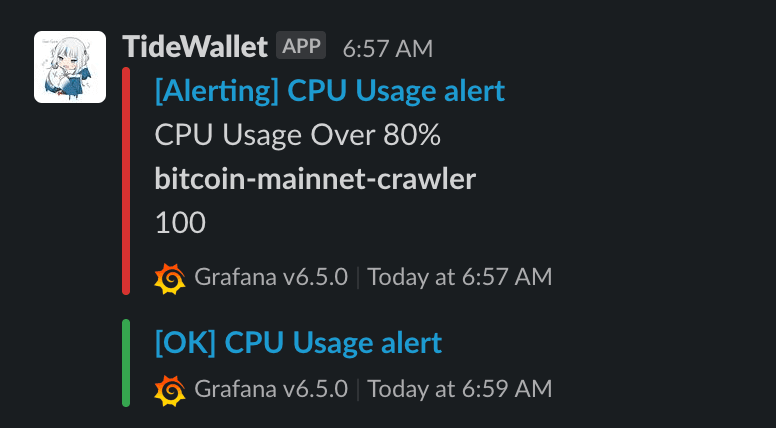
Alert
前面有提到這邊也有告警的機制,簡單說就是設定一個臨界值,當超過後會先進入 Pending 狀態,然後在超過你設定的時間後系統就會跳出通知
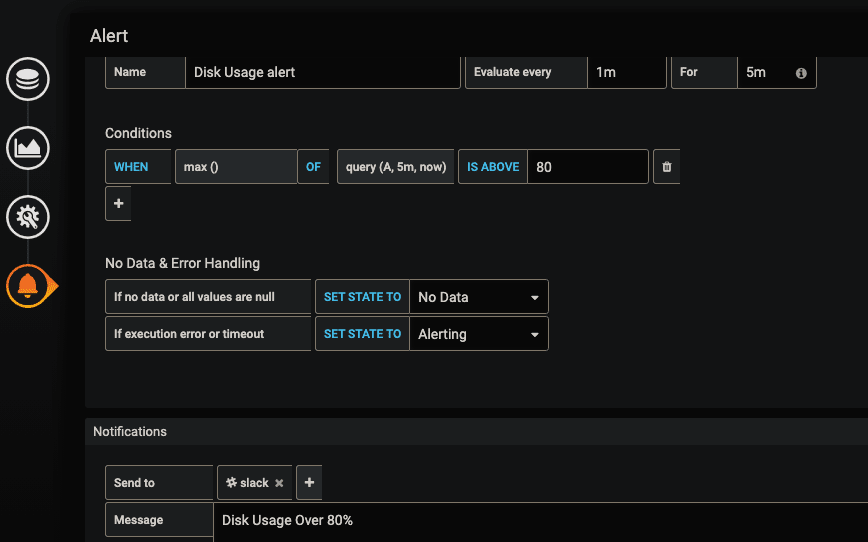
以圖片為例
每 1 分鐘檢查一次,當超過臨界值 5 分鐘 後發出通知(也就是 Pending 超過 5 分鐘後)
而臨界值的判斷為,5分鐘內的最大值超過 80 時
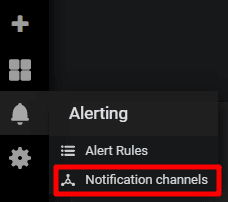
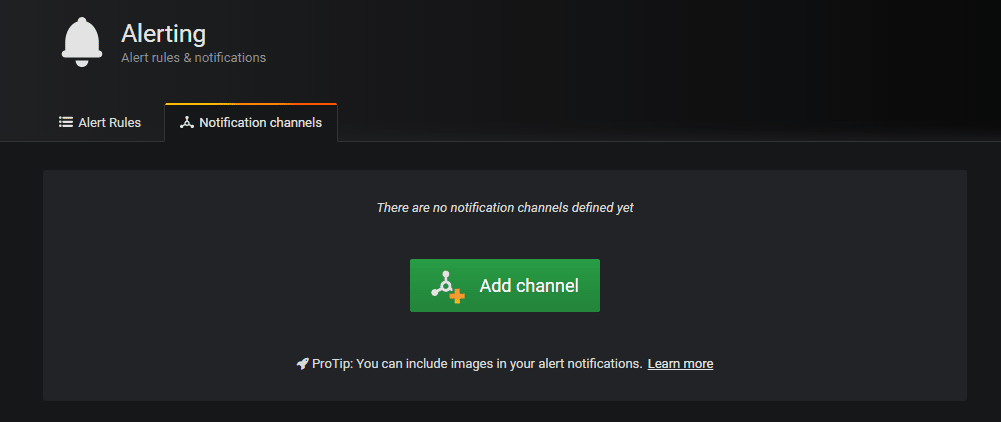
Slack Webhook
這邊可以選擇多種推撥裝置,這裡以 slack 為例
在 Slack 那邊拿到 Webhook URL 後
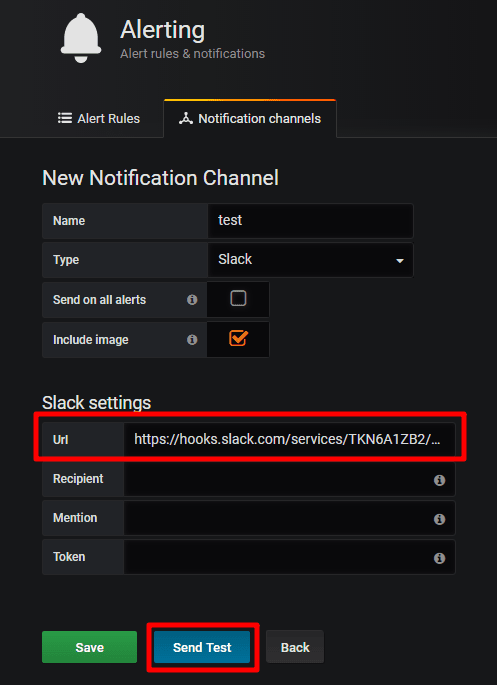
當條件都達成時
RDS 監控
因為我們 DB 有用到 RDS,所以又而外去研究了一下
找到的文章都寫了需要透過 CloudWatch 取得 AWS 上機器的 Metrics
結果最後還是繞回到 CloudWatch 了 (´・ω・`)
然後意外發現 grafana 的 DataSource 有 CloudWatch 這個選項
設定好 Access Key ID 跟 Secret Access Key 就能使用了
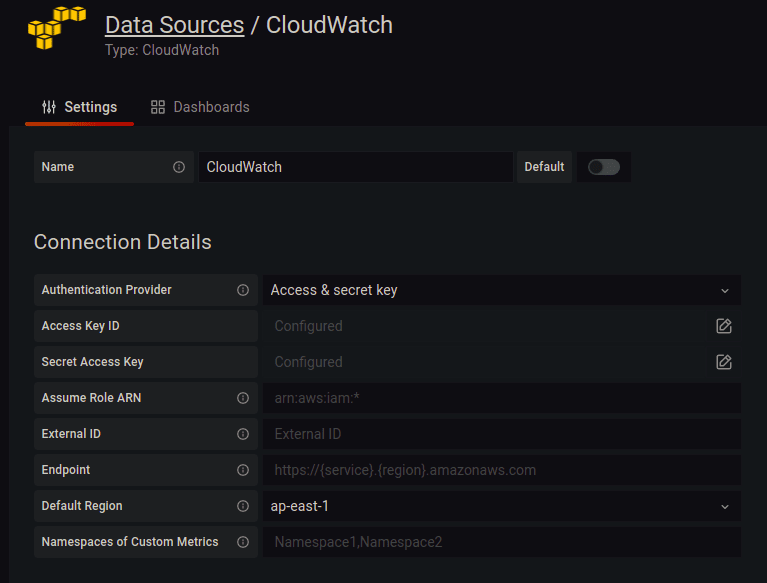
然後一樣簡單的 Import 別人寫好的 Dashboard
調一下 PromQL 就能使用了
結語
這邊只有簡單的講到一些功能,發現還有很多設定可以強化使用體驗
不過這個階段下,這邊很夠用了,另外原本也想把 Log 也串進 Grafana
Loki + Promtail + Grafana,不過這邊在 Promtail 傳資料到 Loki 遇到了些問題,如果有解的話應該會是另一篇文章了吧
(´・ω・`) 近期換了新工作,前一份工作累積了不少沒有整理的筆記,也須接下來可以花些時間把整理完的丟過來這邊(沒有拖延的話)